
Talent acquisition is one of the biggest ongoing investments a business makes in the modern enterprise. However, when executive teams review quarterly budgets, recruiting spend is often misunderstood or underestimated. Unlike fixed operational costs, hiring costs can vary widely depending on the market, the roles being filled and the strength of the internal HR funnel.
In terms of maximizing their budgets, talent leaders and chief financial officers need to pay close attention to exactly how hiring a new employee impacts their bottom line. You can’t justify new technology investments, or measure the success of a restructured hiring team, without a clear financial baseline.
If you want to eliminate guesswork and achieve real operational efficiency, this guide will give you the ultimate framework. We demystify the industry-standard financial metrics, discuss realistic benchmarks for the current market, expose the hidden costs most organizations overlook and provide actionable tactics to constantly optimize your recruiting budget without compromising the quality of your candidates.
What is cost per hire, and what does the standard SHRM/ANSI formula include?
Cost per hire is a standardized measurement of the total financial investment needed to source, attract, evaluate, and onboard a new employee in foundational HR metrics.

Standard CPH-001 was developed by SHRM (Society for Human Resource Management) and ANSI (American National Standards Institute) to provide uniformity across different industries. This standard calls for a true calculation to include the internal operational costs of running a talent team and external vendor costs associated with acquiring the candidate.
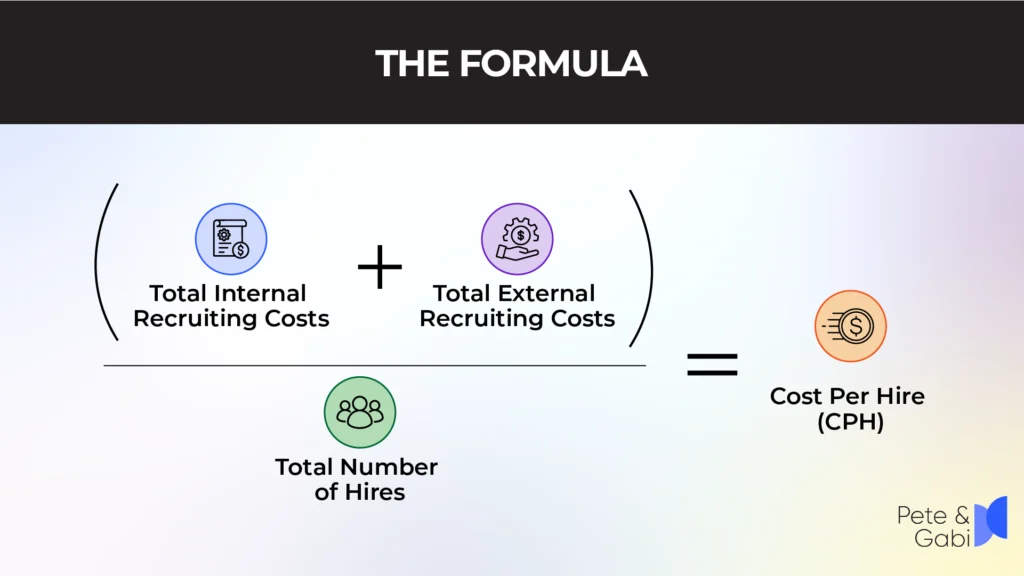
The standardized cost per hire formula is remarkably straightforward, but the complexity lies in correctly identifying and bucketing those costs. Here is how the SHRM/ANSI methodology breaks down the two categories:
| Cost Category | Internal Recruiting Costs | External Recruiting Costs |
| Personnel | Recruiter, sourcer, and HR coordinator base salaries and loaded overhead. | Third-party recruitment agency and retained executive search fees. |
| Time & Labor | Hiring manager and panel interviewer time (calculated by their hourly wage rate). | Consultant fees for external interviewing or specialized assessments. |
| Technology | Applicant Tracking System (ATS) licenses and internal sourcing software. | Job board postings, digital advertising spend, and external career fairs. |
| Administrative | Internal employee referral bonuses and corporate hiring event logistics. | Background checks, drug screening, candidate travel, and sign-on bonuses. |
(Source: Adapted from the SHRM/ANSI standard cost methodology)
What’s a realistic cost-per-hire benchmark right now, by role level?
Knowing the exact way to calculate cost per hire is only useful if you have a benchmark to compare it against. The usual yardstick, historically, has been around $4,129, but inflation-adjusted expectations have changed quite a bit.
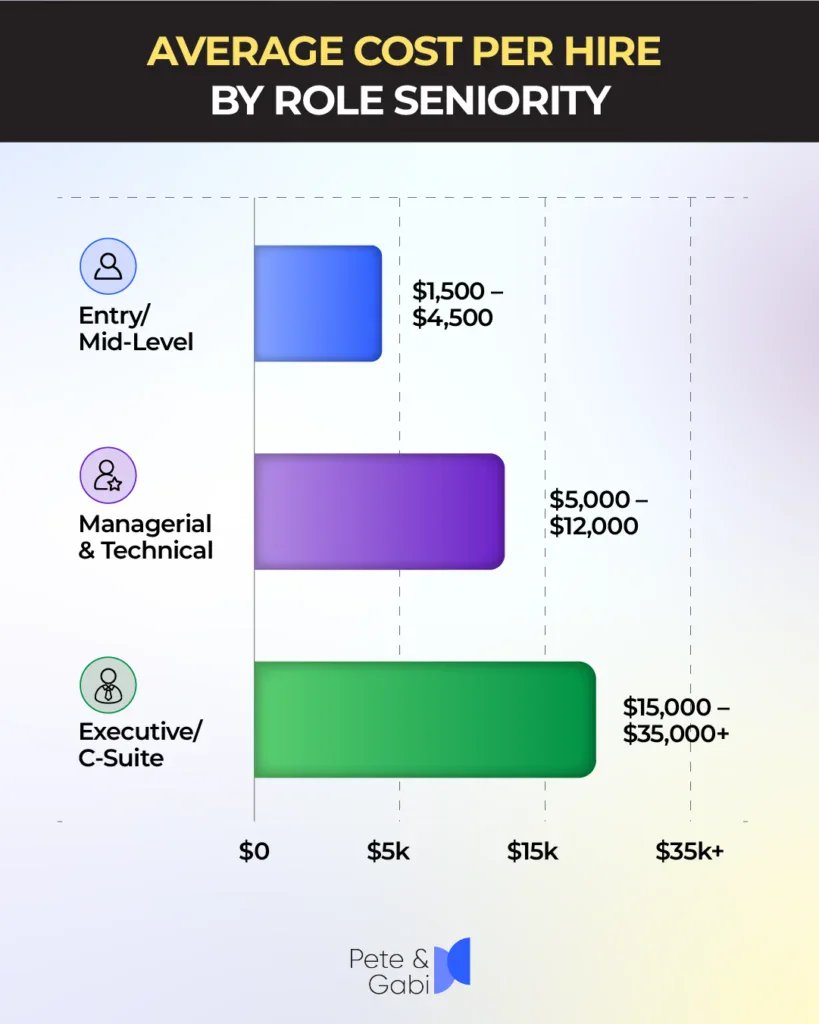
The resources to hire a junior associate are vastly different than a Vise President and therefore calculating one blended average for an entire company is often misleading. Average cost per hire 2026 is very dependent on the seniority and technical complexity of the open position.
| Role Seniority Level | Typical 2026 Cost-to-Hire Range (US) | Primary Cost Drivers |
| Individual Contributor (Entry/Mid) | $1,500 – $4,500 | Job board advertising, ATS licensing, high-volume recruiter screening time. |
| Management & Technical (Engineering) | $5,000 – $12,000 | Extensive panel interview hours, specialized sourcing tools, premium job postings. |
| Executive Leadership (Director/C-Suite) | $15,000 – $35,000+ | Retained executive search firm fees (often 30% of base salary), extensive travel, sign-on bonuses. |
(Reference Data: Compiled from SHRM benchmarking reports and industry-standard hiring data)
What costs do most teams forget to count (and why your real number is probably higher)?
Many times when organizations run the numbers for the first time they celebrate an artificially low metric, not accounting for the “hidden” financial drains of the recruitment process. The SHRM/ANSI framework is great for tracking direct spend but it completely overlooks the most devastating financial metric of them all: vacancy cost.
Vacancy cost is the real opportunity cost of the loss of revenue or productivity that occurs on a daily basis when a position is not filled.
When a quota bearing enterprise sales rep position is open for 60 days, the company is not only paying the recruiter’s salary, but also losing tens of thousands of dollars in deals that don’t get closed. Even in non-revenue roles, an empty seat requires existing employees to work overtime (increasing the risks of burnout and retention) or delays critical product launches.

Beyond hiring expenses, teams often leave out:
Hiring Manager Time: Hiring Managers come out of department P&Ls (Marketing, Engineering, etc) not the HR budget, so their interview hours are rarely tracked. Five hours of six people on an interview panel who spend it on a candidate who refuses the offer is a huge untracked financial loss.
Onboarding and Ramp Time: Hiring cost doesn’t end at the door. The cost of training a new employee to full productivity is a significant operational cost.
The Cost of a Bad Hire: If you replace a misfit in the first six months, the company has to pay the initial hiring cost twice, and there is no perceived budget savings.
What actually drives cost per hire up — slow screening, agency overuse, and process bottlenecks, not just headcount?
When budgets are tight, the standard thinking among executives is the only way to save money is to fire internal recruiters. It’s not usually headcount that drives a high baseline cost, but process bottlenecks in the system that force the company to rely on expensive external crutches.
There are three major inefficiencies that aggressively inflate your recruitment budget:
Slow initial screening: If HR takes 3 weeks to do initial phone screens, the best candidates get offers elsewhere. This forces the company to pay more for job ads to fill a dying pipeline.
Agency Overuse: Staffing agencies are great for niche roles, but if an internal team is relying on them to fill standard, mid-level positions because they don’t have the bandwidth to source themselves, contingency fees (often 20% to 30% of the candidate’s salary) will destroy the hiring budget.
Misaligned Hiring Panels: Highly paid directors spend hours interviewing unqualified candidates because recruiters do not vet candidates deeply before sending them to the hiring manager. This is an invisible but huge labor cost.
What levers bring cost per hire down without cutting hiring quality?
The goal is not simply to slash budgets; it is to maximize the efficiency of every dollar spent. To reduce cost per hire sustainably, talent acquisition leaders must optimize the workflow rather than just cutting corners.
| Strategic Focus Area | Traditional Slow Workflow (High Cost) | Optimized Modern Workflow (Low Cost) |
| Top-of-Funnel Screening | Manual phone tag taking 7–14 days, resulting in massive candidate drop-off. | Automated conversational screening completing evaluations on day one. |
| External Agency Reliance | Defaulting to 20% contingency agencies for standard mid-level roles. | Leveraging internal automated sourcing to reserve agencies only for executives. |
| Time-to-Fill Velocity | 45+ day average, compounding massive daily vacancy costs. | 20-day average, drastically minimizing lost organizational productivity. |
| Candidate Quality Filter | Unvetted candidates reaching hiring managers, wasting valuable executive time. | Rigorous, rubric-based AI vetting ensuring managers only see top-tier talent. |
Implementing these specific operational levers allows a company to shrink their timeline, which inherently lowers both direct spend and hidden vacancy costs. For a deeper tactical look at accelerating this pipeline, review our guide on how to reduce time-to-hire.
How do you calculate your own cost per hire?
Step one is to understand the theory, step two is to calculate your own unique metrics for your organization. You can’t optimize a baseline you haven’t actively measured.
Our interactive Recruitment ROI Calculator makes this a seamless process by instantly calculating your exact spend based on your team’s inputs, agency fees and internal bandwidth.

If that final figure makes you uncomfortable, intelligent automation is the quickest way to get it down. Enterprise organizations are transforming the economics of their hiring processes by deploying Rebecca AI Recruiter as a first-pass screening co-pilot.
Published customer-deployment results of Rebecca AI show:
- Eliminate calendar delays and reduce agency reliance for up to 60% lower cost-per-hire.
- 85% reduction in cost-per-screen and complete elimination of the man-hours involved in manual phone screens.
Discover our comprehensive breakdown on the ROI of AI video interviews for enterprise to see how adopting state-of-the-art voice-screening technology results in significant financial gains.
Don’t Overpay for a Slow, Manual Pipeline. Get your baseline today and when you’re ready to cut your hiring spend dramatically without sacrificing talent, sign up for Rebecca AI and see the impact on the bottom line for yourself.